
These worked examples cover the fundamental interaction patterns used throughout the GDI Window: the different ways to run and repeat a command, the several methods for entering a coordinate, location, or dimension when prompted, using grips to reposition a feature by dragging, and setting the GDI Display’s coordinate units. Several of these methods share the same “@” symbol syntax for entering a relative distance and angle, so learning it once pays off across coordinate, dimension, and location prompts alike.
Execute A GDI Command
Describes the methods for running a command in the GDI Window.
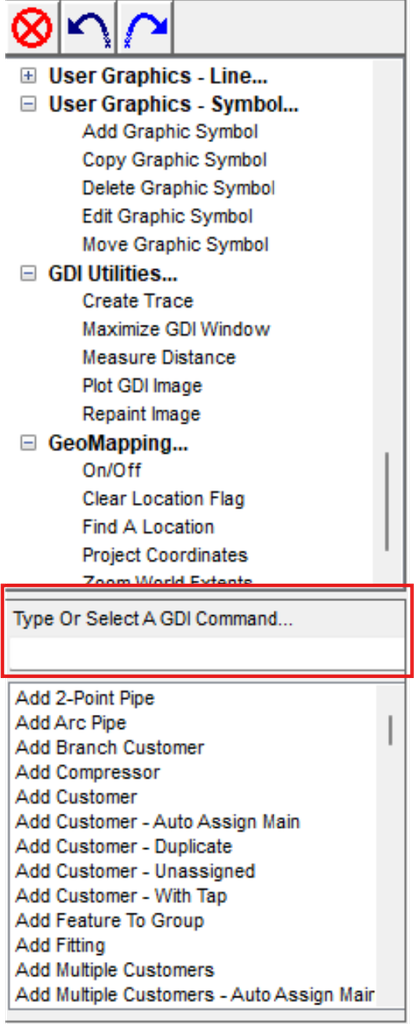
- GDI Command Tree: left-click the box next to a branch, or double-click its text, to expand or collapse it. Under an expanded branch, left-click a command name to run it.
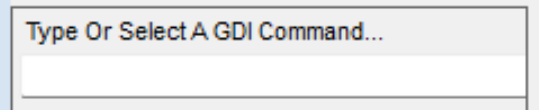
- GDI Command List: lists every GDI Command alphabetically. Scroll manually, or type a name in the Type Or Select A GDI Command field to jump to the first match, then left-click the command name.
- GDI Command Line: located below the GDI Display. Type a command’s code and press Enter. Codes aren’t case-sensitive and can contain spaces.
- Tool Palette: if commands have been added to your customized Tool Palette, click a GDI Icon to run it directly.
Notes
- Running a command while a feature is already selected uses that feature automatically if it matches the command’s required type — for example, selecting a pipe and running Delete Pipe deletes it without prompting. If the selected feature doesn’t match, it’s unselected and the command runs normally instead — selecting a pipe and running Delete Customer won’t delete the pipe.
- Some commands have no prompts or messages, so it’s worth checking the result after running one rather than repeating it unnecessarily.
- To cancel a running command, click the Cancel icon in the upper-left corner of the GDI Window.
Repeat A GDI Command
Runs the last GDI Command used in the GDI Window again.
- With the GDI Window active and the GDI Command Line empty, right-click the mouse. If no other command is currently running, the last command used runs again.
Notes
- Commands can’t be repeated while another command is currently running.
Enter GDI Coordinates
Describes the methods for entering or specifying a feature’s coordinates when prompted for a location.
- Graphic: left-click a point in the GDI Display.
- Node Selection: with Feature Snap enabled, click with a node inside the snap target circle. Without it enabled, move near a node, hold Shift, and left-click.
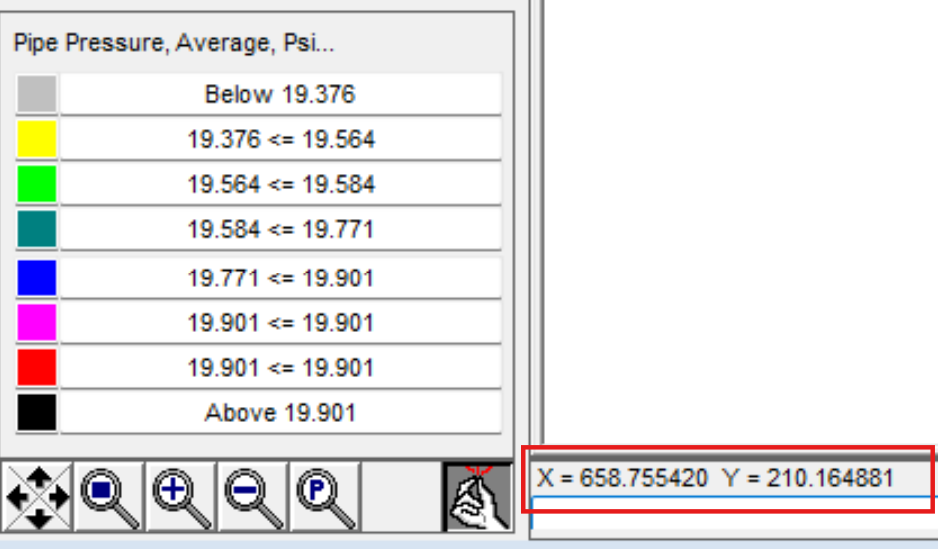
- Coordinate Entry: type a coordinate pair (X,Y) on the GDI Prompt Line and press Enter. Values must be in the current Coordinate Values dimensional units, without decimals.
- Entered Distance & Angle: type @length<angle (for example, @500<90) and press Enter to draw a line of that length at that angle, measured clockwise from the Y-axis.
- Entered Distance/Selected Angle: type @distance<? (for example, @500<?) and press Enter, then click a point in the GDI Display at the Pick A Point To Establish The Angle prompt to set the direction.
- Entered X-Y Distance: type @X-distance,Y-distance (for example, @500,500) and press Enter to place a point that far from the previous one along each axis.
- Node Entry: type N followed by a node’s name (for example, N101) and press Enter to select that existing node.
Notes
- X-values run from -99999999 in the west to 99999999 in the east; Y-values run from -99999999 in the south to 99999999 in the north.
- If more than one node falls within the snap target circle, the node with the lowest Record Number is used.
- The snap target is the Feature Snap Ratio multiplied by the default Node Symbol Size, both changeable on the Graphics data tab of the User Options & Settings screen (Utilities menu). When Feature Snap is enabled, a circle displays around the crosshairs with a radius equal to the snap target — a click or typed coordinate near a node inside that circle selects the node.
Set A Feature’s Location
Describes the different ways to set the location of a model feature — a node, User Graphic, User Text, or vertex — in the GDI Display.
Any Model Feature
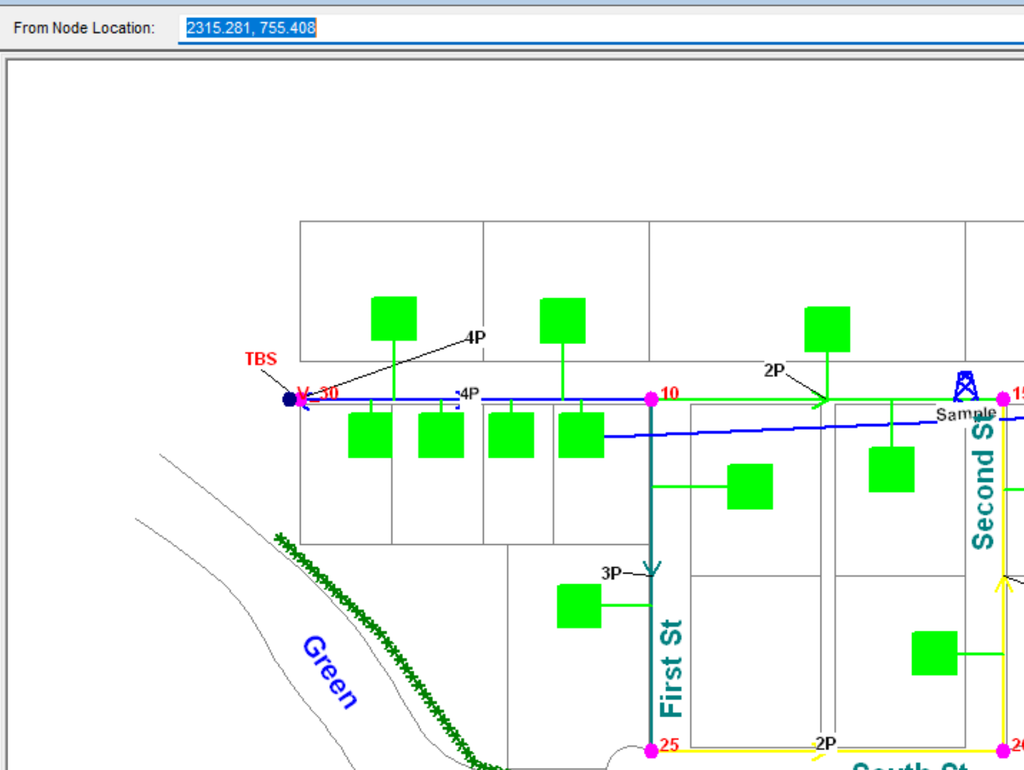
- Graphic: left-click a point in the GDI Display to place the feature there.
- Coordinate Entry: type a coordinate pair (X,Y) and press Enter to place the feature at those coordinates.
- Entered Distance/Angle: type @distance<direction (direction in degrees clockwise from the Y-axis) and press Enter to place the To Node at that distance and angle from the From Node.
- Entered X-Y Distance: type @X-distance,Y-distance and press Enter to place the To Node that far from the last point.
Node Specific
- Default: if a prior command created a new node, its coordinates display on the GDI Prompt Line — right-click or press Enter to accept that location as the From Node.
- Entered Distance/Selected Angle: type @distance<? and press Enter, then click a point at the Pick A Point To Establish The Angle prompt to set the direction.
- Node Entry: type N followed by a node’s name and press Enter to select that node as the From Node.
- Node Selection: with Feature Snap enabled, click with a node inside the snap target circle. Without it, move near a node, hold Shift, and left-click. Either way, the selected node becomes the From Node.
Text Specific
- Automatic: type A and press Enter to set the text to its default location and end the command.
Set A Feature’s Dimensions
Describes the different ways to set the width, height, and rotation of a User Graphic, User Table, or User Text feature.
Rotation
- Graphic: left-click a point — the angle of the displayed line sets the feature’s orientation.
- Default: type D and press Enter to set the text rotation to its default value.
- Value Entry: type an angle (in degrees clockwise from the Y-axis) and press Enter to set the orientation exactly.
Height
- Graphic: left-click a point — the feature’s height is set to the length of the displayed line.
- Default: if a prior command created a new node, right-click or press Enter to accept its displayed coordinates as the From Node.
- Value Entry: type a value (in the default Prompted Length Values units) and press Enter to set the height exactly.
- Entered Distance/Selected Angle: type @distance<? and press Enter, then click a point to set the direction; the To Node is placed at that distance in the chosen direction.
Width
- Graphic: left-click a point — the feature’s width is set to the length of the displayed line.
- Value Entry: type a value (in the default Prompted Length Values units) and press Enter to set the width exactly.
Grips
How to enable and use grips — in this example, to move a pipe end and its associated text.
Enable Grips
- From the Utilities menu, select Options & Settings.
- On the Graphics data tab, select the Display Grips option, then click Apply to close the screen.
Display Pipe Text & Leader Lines
- Select Text Display Settings from the Display Settings branch of the GDI Command Tree.
- On the Pipe Items tab, select Display Pipe Text Items and Leader Lines On Moved Text, and confirm at least one pipe text item is selected under Items.
- Click Apply to save the changes.
Move A Pipe End
- Left-click a pipe to select and highlight it. Two small squares display over its ends — these are the pipe-end grips.
- Left-click one of the grips.
- At the New Location prompt, left-click another point in the GDI Display. The dashed line shows the new pipe route.
- If a new node is created and Prompt For Data During New Feature Entry is enabled, the Node Data displays in the Data Panel — right-click to accept the defaults, or click Apply Data Values if changes were made.
- If Automatically Update Pipe Length is enabled, the Hydraulic Length recalculates automatically. Otherwise, confirm whether to update it. The pipe redraws to its new location.
Move The Pipe Text
- Left-click a pipe to select and highlight it. A small square displays at its center — this is the text grip.
- Left-click the square.
- At the New Text Location prompt, left-click another point. The text moves there, with a leader line drawn back to the pipe.
Notes
- This example uses pipes, but grips also work on customers, nodes, service taps, User Graphics (Images, Lines, Symbols), User Text, vertices, and any text associated with those features.
- When moving a node, don’t select its connected pipe instead — that moves the pipe end, not the node. If you select the pipe by mistake, press Esc, then left-click the node directly.
- If the Allow Undo Of Data/Graphic Changes environment option is selected (Environment data tab, Options & Settings), click the Undo icon to restore the last data or graphic change.
Set The GDI Coordinate Units
Establishes the Coordinate Values dimensional units for the GDI Display.
- From the Utilities menu, select Options & Settings.
- On the Units data tab, select a unit from the Coordinate Values list.
- Click Apply to apply the new units to the model, or Close to return without applying them.
Notes
- Coordinate Values units are saved to the model data — opening a different model or starting a new one switches to that model’s own saved or default value. Click Save As Default on the Units tab to make the current setting the default for new models.
- Changing these units doesn’t rescale the model image — switching from Feet to Inches, for example, turns a 12-foot distance into 12 inches with no visual change. Use Shift The Model Coordinates if you actually need to rescale the model.
- Coordinate Values units aren’t the same as Length Values units. Coordinate Values only affect distances as scaled or measured in the GDI Display; when a new pipe is added, its graphic length converts from Coordinate Values units into Length Values units to calculate Hydraulic Length. When entering relative distances during pipe entry, use Length Values units.
Notes & Considerations
- The @distance<angle syntax (and its @distance<? and @X,Y variants) shows up across coordinate, dimension, and location prompts alike — learning it once carries over to entering pipes, setting feature dimensions, and placing nodes.
See Also
- Coordinates, Projection & Snapping
- Display & Visibility Settings
- GDI Utilities: Undo, Redo, Cancel & Housekeeping
- Example: Selecting, Moving & Viewing Features
- Example: Fittings, Panels & Palettes
FAQ
-
Which model file format should I choose when creating a new model?
For GASWorkS 11 we recommend the “.gwz” format, which stores the entire model as a single file. The older “hdr” format from GASWorkS 10.2 and earlier is still supported, but it stores the model as a group of individual files.
-
Do I have to set the default data values before I start building?We general advise to do so, because every new node and pipe is populated from the current default data values, allowing to avoid setting new values for every imported pipe. Additionally, default data values can be saved, allowing for new models to automatically use the same configuration. As an alternative, you can also select ‘Use Last Record As Default’ on the Default Data tab, which populates a new feature from the last similar feature already in the model.
-
What are the different ways to enter a node’s location?You can type an X-Y coordinate pair (for example, 1000,1000), enter a relative distance and angle prefixed with “@” (for example, @500<180, measured clockwise from north), or draw the segment with the mouse. You can also reference an existing node by name using the "N" prefix — typing "N SUPPLY" uses that node's location.
-
What does a negative load value mean?A negative load indicates gas leaving the system — a demand. Positive values, by contrast, represent gas entering the system.
-
My model has negative pressures after I added the new tap. What happened?Negative (below-zero) pressures mean the system has effectively “run out of gas” — the added demand is greater than the network’s capacity. To address this issue, we generally recommend using the color-coding feature (by Pipe Pressure Drop) to find the pipes with the highest drop, and resizing to a larger pipe where possible.
-
Why do I need to solve the model again after making a change?Any change to the model invalidates the previously computed pressures and flows, so you will need to re-solve to get valid results after you change an input. The Solve icon tells you the state of the calculator at a glance: the scale shows balanced (blue) after a successful solution and unbalanced when a change means a new solution is needed.
-
Can I export the report data to a spreadsheet?Yes. You can save the report directly as a Comma Separated Values (.csv) file and open it in a spreadsheet, or copy the report contents to the Windows Clipboard and paste them into another application. You can also use the Set Columns routine to choose which columns display and print, and build query-based selection sets to filter and sort the records.