
These worked examples walk through color-coding a solved model by query and by range, setting an appropriate Display Limit for pipe text, panning and zooming with the mouse, and general tips for speeding up the graphic display. Color coding set through these routines is temporary — save it with Save The Feature Colors if you want it to persist, since running another color routine (including a Trace) will overwrite it.
Color Code By Query
A step-by-step guide to color-code pipes by a data value, using pressure drop across the pipe.
- Open A Model: from the File menu, select Open. On the Open screen, navigate to the “GASWorkS 11\files” folder, select “distribution demo.hdr,” and click Open. Maximize the GDI Window (GDI Utilities branch of the GDI Command Tree) and click Zoom To Fit.
- Solve The Model: click the Solve icon in the lower-right corner of the GDI Window. On the Solution Data screen, the default settings are fine — click Solve, review the Solution Log, then click Close.
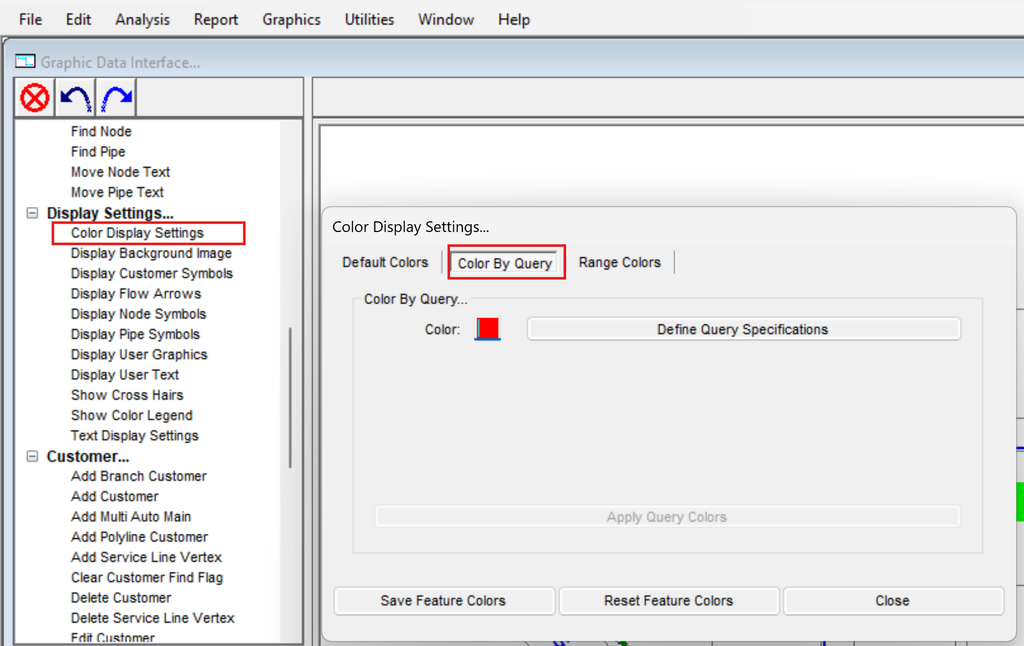
- Select Color Display Settings from the Display Settings branch of the GDI Command Tree.
- On the Color By Query tab, left-click the color panel, select Red, and click OK.
- Click Define Query Specifications. On the Query Specifications screen, select “Pipe Pressure Drop” from the Where list, “Max” from the Is list, type “2” in the To field, and click Perform Query. Confirm the reported match count, then click Close.
- Click Apply Query Colors to return to the GDI Window. The matching pipes display in the selected color.
Color Code By Range
A step-by-step guide to color-code pipes by a range of data values, using average pipe pressure.
- Open A Model: from the File menu, select Open, choose “distribution demo.hdr” from the “GASWorkS 11\files” folder, then click Open. Maximize the GDI Window and click Zoom To Fit.
- Solve The Model: click the Solve icon, accept the default settings, click Solve, review the Solution Log, then click Close.
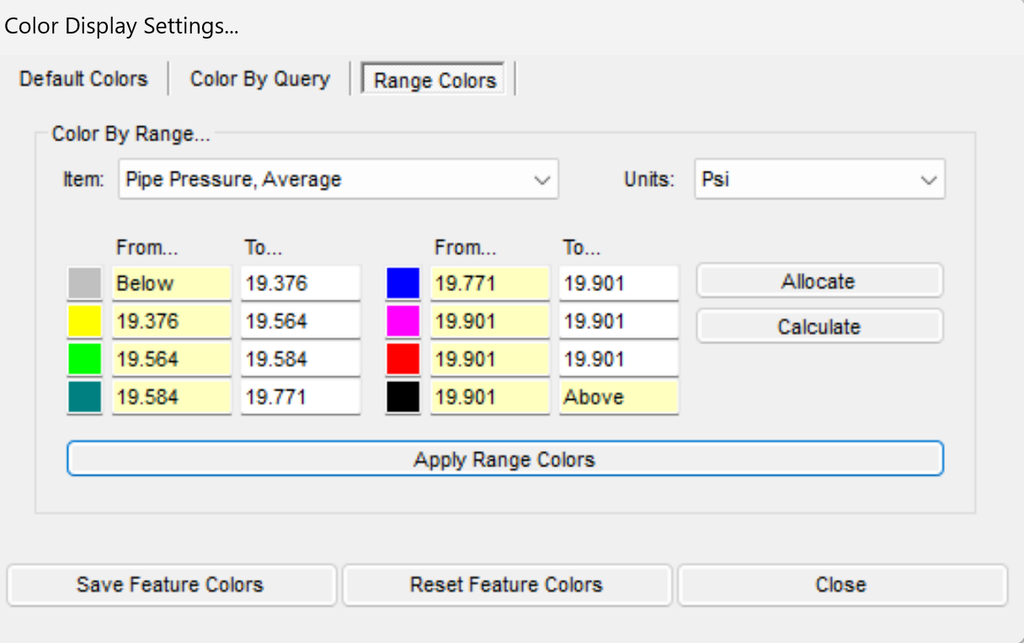
- Select Color Display Settings from the Display Settings branch of the GDI Command Tree.
- On the Range Colors tab, select “Pipe Pressure, Average” from the Item list and “Psi” from the Units list. Click Allocate to create a color range, then click Apply Range Colors to return to the GDI Window.
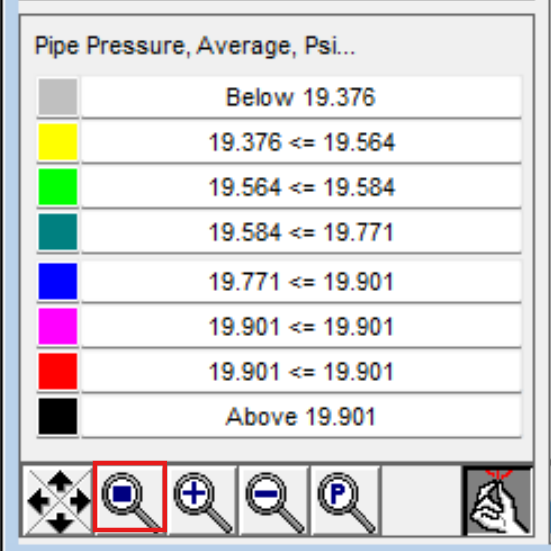
- Select Show Color Legend from the Display Settings branch of the GDI Command Tree. The Color Legend displays in the lower-left corner of the GDI Window.
Notes
- Pipes, customers, and nodes can all be color-coded by range using several other data items, listed in the Items list on the Color By Range tab.
- The Allocate method used here creates ranges with roughly equal numbers of features in each. The Calculate method instead finds the highest and lowest value for the item and creates eight roughly equal-sized ranges, which may not contain equal feature counts. Ranges can also be set manually by typing values into the To fields — the From fields autofill from the previous To value.
- To change a range’s color, left-click its color panel, select a new color on the Color screen, and click OK.
Determine An Appropriate Display Limit
Two methods for setting the Display Limit so pipe text items show up appropriately when the model fills the GDI Display.
Method 1 — Determine The Display Limit By Measurement
- Click the Zoom To Fit icon in the lower-left corner of the GDI Window.
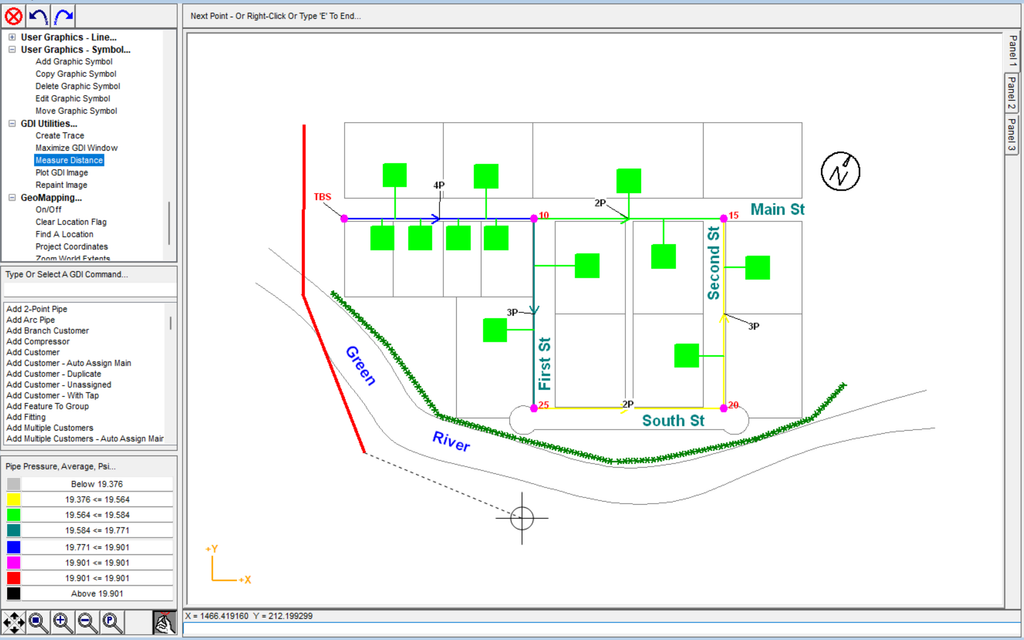
- Select Measure Distance from the GDI Utilities branch of the GDI Command Tree. At the First Point prompt, left-click as close as possible to the lower-left corner of the GDI Display. At the Next Point prompt, left-click as close as possible to the upper-right corner. Right-click to end the routine.
- On the Measured Values screen, note the Absolute Distance value (in the Coordinate Values dimensional units), then click OK.
- Select Text Display Settings from the Display Settings branch of the GDI Command Tree. On the Pipe Items tab, enter the Absolute Distance value (or a slightly larger number) into the Display Limit field, then click Apply.
Method 2 — Automatically Determine The Display Limit
- Click the Zoom To Fit icon in the lower-left corner of the GDI Window.
- Select Text Display Settings from the Display Settings branch of the GDI Command Tree. On the Pipe Items tab, double-click the Display Limit field — the value updates to the current diagonal extent of the GDI Display. Click Apply to save the change.
Notes
- The Display Limit measures the GDI Display’s extent diagonally, corner to corner. Associated feature text is visible only when the display is zoomed in below that value; a value of zero makes the text visible at every zoom level.
- The right Display Limit depends on the model — setting it well helps keep text from covering model features, and vice versa.
- The Display Limit value is saved with the model data. Opening a different model, or creating a new one, changes it to that model’s own saved or default value.
Automatically Pan & Zoom GDI Display
Pan and zoom the GDI Display image using only the mouse.
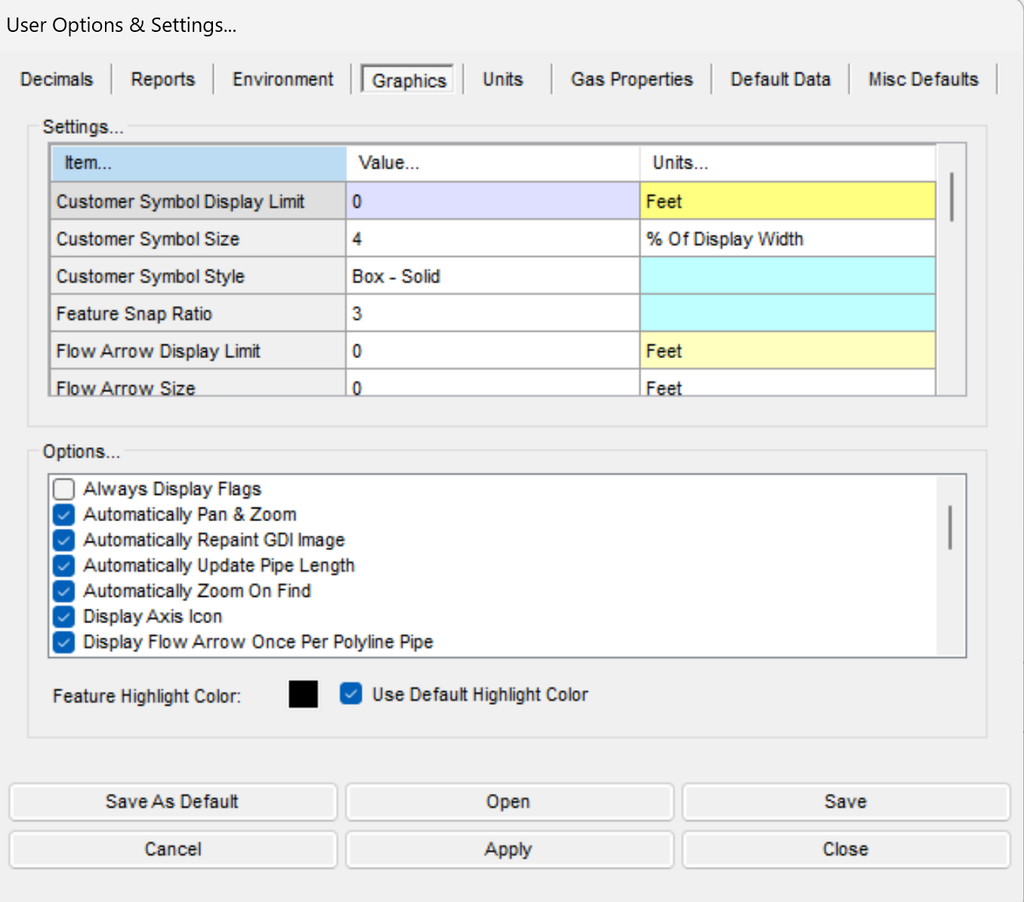
- From the Utilities menu, select Options & Settings.
- On the Graphics data tab, select the Automatically Pan & Zoom option.
- Click Apply, then Close, to return to the GDI Window.
Pan
- Move the mouse pointer to a point in the GDI Display and click and hold the left mouse button.
- While holding the button, move the crosshairs to another point — a line displays showing the drag distance and direction.
- Release the left mouse button to move the image.
Zoom In
- Move the mouse pointer toward the upper-left corner of the GDI Display and click and hold the right mouse button.
- While holding the button, move the crosshairs below and to the right of the first point — a box displays representing the zoom window.
- Release the right mouse button to zoom to that window.
Zoom Out
- Move the mouse pointer toward the lower-right corner of the GDI Display and click and hold the right mouse button.
- While holding the button, move the crosshairs above and to the left of the first point — a line displays; the longer the line, the further the image zooms out.
- Release the right mouse button to zoom out.
Notes
- Automatically Pan & Zoom can’t be used while a GDI Command is running — use the Scroll icon to move the image mid-command instead.
- To return to the last view, use the Zoom Previous command.
Increase The GDI Image Display Speed
A list of suggestions for improving graphic display performance, all set from the Graphics data tab of the User Options & Settings screen (Utilities menu) unless noted otherwise.
- Use solid-style pipes by selecting “Solid” from the Pipe Line Symbol Style list.
- Use a narrower pipe line by decreasing the Pipe Line Thickness value.
- Select the Ignore Pipes Outside GDI Display option.
- Consider whether customers, nodes, pipe symbols, flow arrows, User Graphics, and User Text all need to be displayed — each one takes time to render. See the various Display topics for how to hide the ones you don’t need.
- Text items in particular can slow the display down. Use the Display Limit values on the Text Display Settings screen to limit the zoom scale at which text appears, and turn text off entirely when it isn’t needed.
- Turn off background image display when it isn’t required, from the Background Image Settings screen (Background Settings item, Graphics list). If a DXF background image is attached, try turning off layers containing text or redundant information.
Notes & Considerations
- Color coding applied by Color Code By Query or Color Code By Range is temporary. To save it, use Save The Feature Colors; to revert to the original colors, use Reset The Feature Colors. Running another color-coding routine — including a Trace — can overwrite the current colors.
See Also
- Display & Visibility Settings
- Colors, Symbols, Sizes & Tool Palette
- Toggling Layers, Logs & GeoMapping
- Views, Panning, Zooming & Plotting
- Solving & Tracing the Model
- Measuring Distances & Angles
- Example: Selecting, Moving & Viewing Features
FAQ
-
Which model file format should I choose when creating a new model?
For GASWorkS 11 we recommend the “.gwz” format, which stores the entire model as a single file. The older “hdr” format from GASWorkS 10.2 and earlier is still supported, but it stores the model as a group of individual files.
-
Do I have to set the default data values before I start building?We general advise to do so, because every new node and pipe is populated from the current default data values, allowing to avoid setting new values for every imported pipe. Additionally, default data values can be saved, allowing for new models to automatically use the same configuration. As an alternative, you can also select ‘Use Last Record As Default’ on the Default Data tab, which populates a new feature from the last similar feature already in the model.
-
What are the different ways to enter a node’s location?You can type an X-Y coordinate pair (for example, 1000,1000), enter a relative distance and angle prefixed with “@” (for example, @500<180, measured clockwise from north), or draw the segment with the mouse. You can also reference an existing node by name using the "N" prefix — typing "N SUPPLY" uses that node's location.
-
What does a negative load value mean?A negative load indicates gas leaving the system — a demand. Positive values, by contrast, represent gas entering the system.
-
My model has negative pressures after I added the new tap. What happened?Negative (below-zero) pressures mean the system has effectively “run out of gas” — the added demand is greater than the network’s capacity. To address this issue, we generally recommend using the color-coding feature (by Pipe Pressure Drop) to find the pipes with the highest drop, and resizing to a larger pipe where possible.
-
Why do I need to solve the model again after making a change?Any change to the model invalidates the previously computed pressures and flows, so you will need to re-solve to get valid results after you change an input. The Solve icon tells you the state of the calculator at a glance: the scale shows balanced (blue) after a successful solution and unbalanced when a change means a new solution is needed.
-
Can I export the report data to a spreadsheet?Yes. You can save the report directly as a Comma Separated Values (.csv) file and open it in a spreadsheet, or copy the report contents to the Windows Clipboard and paste them into another application. You can also use the Set Columns routine to choose which columns display and print, and build query-based selection sets to filter and sort the records.