
This example bundle walks through four everyday GDI Window tasks that work together when building and maintaining a model: attaching a fitting to an existing pipe, reading and editing feature values in the Data Panel, customizing the Tool Palette for quick command access, and applying bulk changes with the Mass Update routine. Each walkthrough assumes GASWorkS has been started, a model is open, and the GDI Window is displayed. Before editing values, confirm the model’s default units and display settings so the changes you make are interpreted the way you expect.
GDI Examples
Attach A Fitting To A Pipe
Attach a fitting to an existing pipe so its equivalent length is included in the pipe’s hydraulic length when the model is solved.
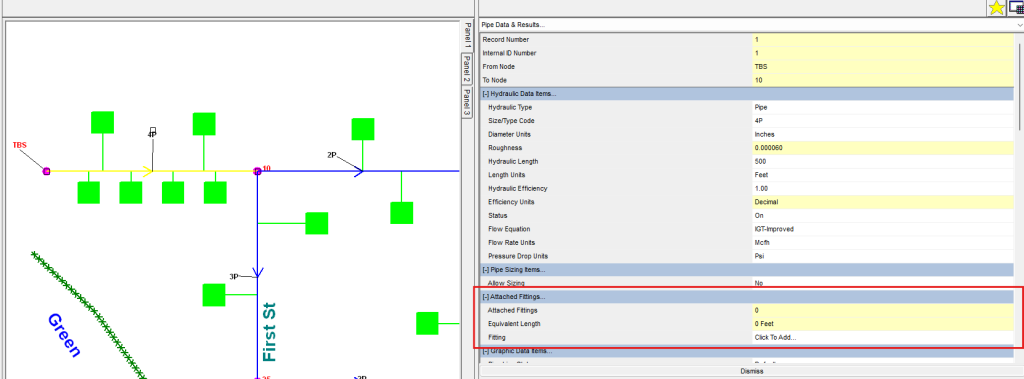
- Select a pipe by moving the mouse cursor over a pipe feature and left-clicking. The pipe is highlighted and its Pipe Data is shown in the Data Panel.
- In the Attached Fittings section, next to the Fitting item, left-click the Click To Add option.
- On the Fitting Selection screen, select a fitting from the Full List, then click the Attach command button.
- The fitting is added to the Fitting list, and the Attached Fittings and Equivalent Length values update.
- Click the Apply Data Values command button to save the change.
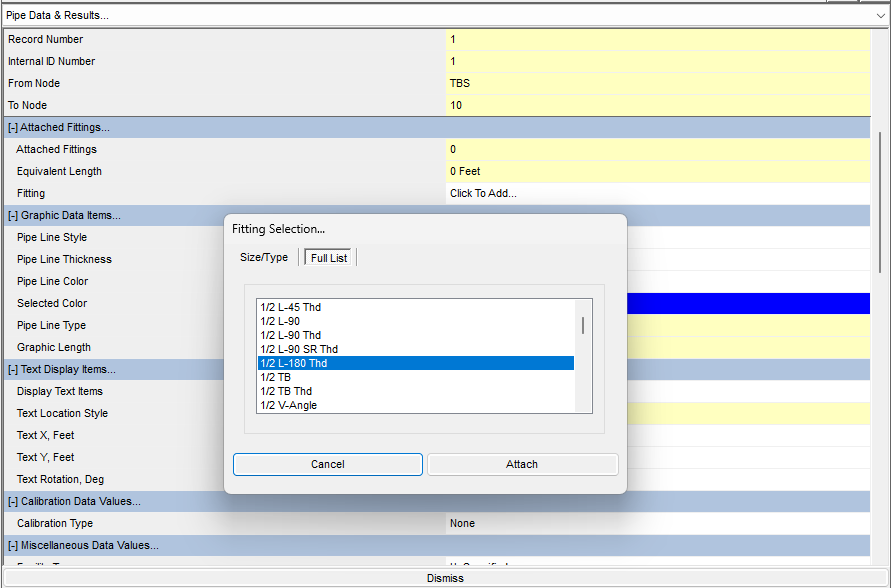
This task is performed directly in the Data Panel after selecting a pipe; it has no GDI Command Line alias. To create a fitting as a standalone graphic feature instead, use the Add Fitting command.
Notes
- The Equivalent Length value in the Attached Fittings section is the sum of the equivalent lengths of all fittings attached to the pipe. When the model is solved, this value is added to the pipe’s Hydraulic Length.
- Left-click in the white cell for any Fitting item to open a list: choose Edit Fitting to change the attached fitting type, Delete Fitting to remove it from the pipe, or Cancel to keep the current fitting.
- Selecting the Pipe Fittings option on the Pipe Items data tab of the Text Display Settings screen labels pipes that have attached fittings with the text “Fittings Attached,” and appends “(F)” to the Pipe Size/Type Code text item.
Use The Data Panel
View or change the data associated with any model feature — including customers, nodes, pipes, User Graphic Images, Lines, Symbols, User Text, and vertices — directly from the GDI Window.
- Left-click a model feature. The Data Panel opens to the right of the GDI Display, showing only the sections that apply to the selected feature type.
- Review the identifying information at the top — Record Number, Internal ID Number, and related details — which is shown for every feature.
- Use the section that fits your task: Hydraulic Data Items (solution inputs for customers, nodes, and pipes), Data Items or Graphic Data Items (appearance in the GDI Display), Text Display Items, Miscellaneous Data Values (Facility Type and Edit Date), Attribute Data Values (linked database fields), and Calculated Values (read-only results from GASWorkS).
- To run a related command, left-click an entry in the Actions section.
- If you changed any values, click the Apply Data Values command button to save them.
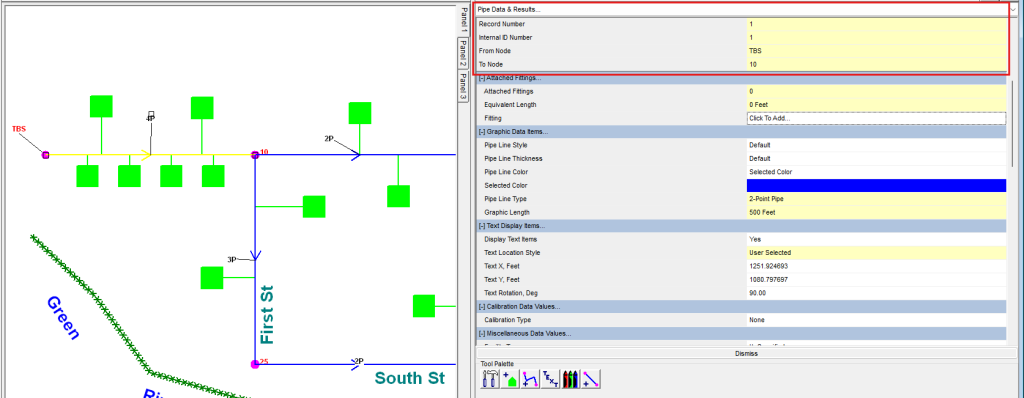
The Data Panel appears automatically when you left-click a feature in the GDI Window; it has no GDI Command Line alias. The Calculated Values cannot be edited directly — change the data used to compute them instead.
Notes
- Select “Default” from the list for the Symbol Color, Symbol Style, Symbol Size Style, or Text Rotation items to use the specified default values. Default Symbol Color values are set on the Color Display Settings screen; default Symbol Style and Symbol Size values are set on the Graphics data tab of the User Options & Settings screen (Utilities menu → Options & Settings); default Text Rotation values are set on the Text Display Settings screen.
Use The Tool Palette
Add commonly used GDI Commands from the GDI Command List to the Tool Palette, giving you another one-click way to execute them.
Add a GDI Command to the Tool Palette
- In the GDI Command List, right-click the GDI Command you want to add.
- When asked whether to “Add The Selected Command To The Tool Palette,” click Yes to add it, or No to exit.
- A GDI Icon appears on the Tool Palette; left-click it to execute the command.
Move a GDI Icon on the Tool Palette
- Move the mouse cursor over the icon, then click and hold the right mouse button to select it.
- While holding the button, drag the icon to a new position on the Tool Palette.
- Release the right mouse button to snap the icon into place.
Remove a GDI Icon from the Tool Palette
- Right-click the GDI Icon you want to remove.
- When asked whether to “Remove The Selected Command From The Tool Palette,” click Yes to remove it, or No to exit.
- The selected GDI Icon is removed from the Tool Palette.

The Tool Palette is managed by right-clicking commands in the GDI Command List and icons on the palette itself; it has no GDI Command Line alias. To clear every icon at once, use the Reset Tool Palette command.
Notes
- Commands without their own GDI Icon are assigned a default icon. When tooltips are enabled, hovering over an icon displays the command text.
- The palette holds only as many commands as fit in its space. When it is full, you must remove a command before adding another. Duplicate commands are not allowed — adding one already present displays a message; click OK to clear it.
- Arrange icons to suit your workflow — for example, group the most-used commands along one edge. The palette configuration is saved when GASWorkS closes and is not specific to a model, so a single setup carries across all your models.
Use The Mass Update Routine
Change a data value for many features at once based on a search condition. This example changes the Symbol Style for every customer with a Unit Count greater than 1.
Open a model
- From the File menu, select Open.
- On the Open screen, navigate to the “GASWorkS 11\files” folder, select the “distribution_demo.hdr” model, then click Open.
- Resize the GDI Window using the Maximize GDI Window item from the GDI Utilities branch of the GDI Command Tree.
- Click the Zoom To Fit icon in the lower-left corner of the GDI Window.
Run the Mass Update
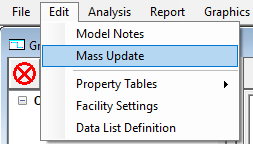
- From the Edit menu, select Mass Update to open the Mass Update Specifications screen.
- In the Value Setting section, set Item Type = Customer Model Data, Set = Symbol Style, and Equal To = Box – Hollow.
- In the Search Specification section, set Apply Only To A Selection Set = Select, Item Type = Customer Model Data, Where = Unit Count, Is = “>” (Greater Than), and To = 1.
- Click the Update command button to proceed.
- A message may report how many records were updated (5 in this example). Click OK to clear it and return to the specifications screen.
- Click the Close command button to return to the GDI Window.
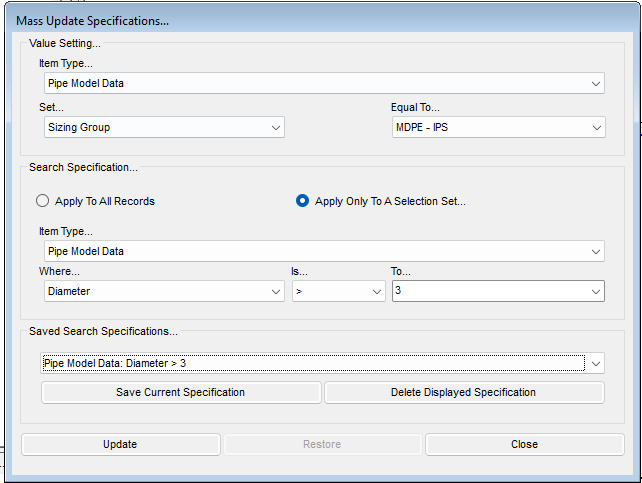
Mass Update is opened from the Edit menu; it has no GDI Command Line alias. For the full list of search operators and their definitions, see the Query Specifications Screen topic.
Notes
- To restore the model to its original configuration, click the Restore command button on the Mass Update Specifications screen (or use the Undo icon, described below).
Notes & Considerations
- Each of these examples assumes GASWorkS is running, a model is open, and the GDI Window is displayed; the Mass Update example additionally opens the “distribution_demo.hdr” sample model to work through.
- If the Allow Undo Of Data/Graphic Changes environment option is selected, click the Undo icon to restore the last data or graphic change — useful after editing values in the Data Panel or running a Mass Update. To enable it, select Options & Settings from the Utilities menu, then open the Environment data tab.
- Default display values referenced in the Data Panel (Symbol Color, Style, Size, and Text Rotation) are controlled from the Color Display Settings, Text Display Settings, and User Options & Settings screens, all reachable from the Utilities menu.
See Also
- Adding Equipment (Compressors, Regulators, Valves & Fittings)
- Editing Customer, Node & Pipe Data
- Editing User Graphics, Text & Tables
- Colors, Symbols, Sizes & Tool Palette
- Display & Visibility Settings
- GDI Utilities: Undo, Redo, Cancel & Housekeeping
- Example: Selecting, Moving & Viewing Features
FAQ
-
Which model file format should I choose when creating a new model?
For GASWorkS 11 we recommend the “.gwz” format, which stores the entire model as a single file. The older “hdr” format from GASWorkS 10.2 and earlier is still supported, but it stores the model as a group of individual files.
-
Do I have to set the default data values before I start building?We general advise to do so, because every new node and pipe is populated from the current default data values, allowing to avoid setting new values for every imported pipe. Additionally, default data values can be saved, allowing for new models to automatically use the same configuration. As an alternative, you can also select ‘Use Last Record As Default’ on the Default Data tab, which populates a new feature from the last similar feature already in the model.
-
What are the different ways to enter a node’s location?You can type an X-Y coordinate pair (for example, 1000,1000), enter a relative distance and angle prefixed with “@” (for example, @500<180, measured clockwise from north), or draw the segment with the mouse. You can also reference an existing node by name using the "N" prefix — typing "N SUPPLY" uses that node's location.
-
What does a negative load value mean?A negative load indicates gas leaving the system — a demand. Positive values, by contrast, represent gas entering the system.
-
My model has negative pressures after I added the new tap. What happened?Negative (below-zero) pressures mean the system has effectively “run out of gas” — the added demand is greater than the network’s capacity. To address this issue, we generally recommend using the color-coding feature (by Pipe Pressure Drop) to find the pipes with the highest drop, and resizing to a larger pipe where possible.
-
Why do I need to solve the model again after making a change?Any change to the model invalidates the previously computed pressures and flows, so you will need to re-solve to get valid results after you change an input. The Solve icon tells you the state of the calculator at a glance: the scale shows balanced (blue) after a successful solution and unbalanced when a change means a new solution is needed.
-
Can I export the report data to a spreadsheet?Yes. You can save the report directly as a Comma Separated Values (.csv) file and open it in a spreadsheet, or copy the report contents to the Windows Clipboard and paste them into another application. You can also use the Set Columns routine to choose which columns display and print, and build query-based selection sets to filter and sort the records.