
This article walks through six everyday GDI Display techniques: selecting a specific feature type with the mouse, panning the model image, opening the GDI Window when it’s hidden, saving the image as a BMP file, plotting the image, and using the Query Specifications screen that several other routines rely on. Most of these are mouse or menu actions rather than typed commands, and users will need to interface with the GDI directly to use these features.
Select A Feature
Uses the mouse, alone or with a modifier key, to select a specific feature type in the GDI Display to view/edit its data or feed it into another routine.
- Nearest feature: left-click anywhere in the GDI Display. The routine selects whichever model feature is closest to the clicked point.
- A customer: hold Ctrl or the “C” key and left-click. The nearest customer is selected.
- A node: hold the “N” key and left-click. The nearest node is selected.
- A pipe: hold the “P” key and left-click. The nearest pipe is selected.
- A pipe vertex: hold the “V” key and left-click. The nearest pipe vertex is selected.
- A User Text feature: hold Alt or the “T” key and left-click. The nearest User Text feature is selected.
Notes
- If more than one feature of the same type occupies the same spot, the one with the highest Record Number is selected. Move that feature to allow the other one(s) underneath it to be selected.
- Running a command while a feature is already selected executes that command using the selected feature, without an extra selection prompt — for example, selecting a pipe and then running Delete Pipe deletes it immediately. If the selected feature doesn’t match the type the command needs, the feature is unselected first and the command runs normally instead (so a selected pipe followed by Delete Customer will not delete the pipe).
- When a running command is waiting for you to select a certain feature type, clicking anywhere in the GDI Display finds the nearest feature of that type — which can produce unexpected results, such as selecting a feature that’s off-screen.
- If the intended feature is hard to click, use the Zoom commands, the Scroll icon, or Automatically Pan & Zoom to reduce congestion or add detail before selecting.
Move The GDI Image
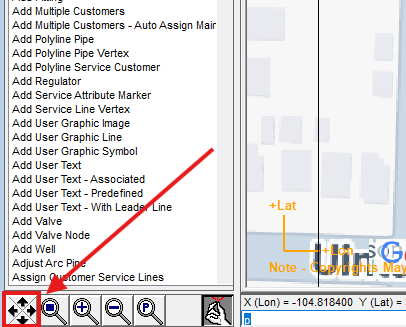
Pans the model image within the GDI Display using the Scroll icon.
- With a model open and the GDI Window displayed, move the mouse cursor over the Scroll icon in the lower-left corner of the GDI Window.
- Left-click one of the arrows to move the model image in that direction.
Notes
- The Scroll icon can move the image even while another GDI command is running.
- The Pan/Scroll Change – Horizontal and Vertical values (Graphics tab, Options & Settings) control how far each click moves the image, as a percentage of the display width and height.
- Use Zoom Previous to return to the last view.
Graphically View A Model
Displays the GDI Window when it’s currently hidden.
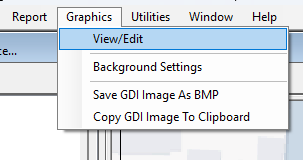
- With a model open and the GDI Window not displayed, select View/Edit from the Graphics menu.
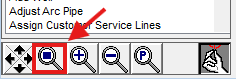
- The GDI Window is displayed. If the model isn’t visible in the image, click the Zoom To Fit icon in the lower-left corner of the GDI Window.
- To close the GDI Window again, select Close GDI Window from the GDI Command List.
Notes
- If no model is open, selecting View/Edit brings up the Open screen instead, so you can choose a model to open and view.
- To close a model entirely rather than just hiding the GDI Window, use Close from the File menu.
Save The GDI Image As A BMP File
Saves the current GDI Image as a bitmap (BMP) file.
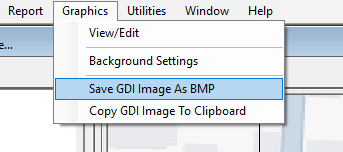
- With a model open and the GDI Window displayed, select Save GDI Image As BMP from the Graphics menu.
- On the Save screen, type a file name for the BMP image and click Save.
- A message may report that the GDI Image has been saved. Click OK to clear it.
Notes
- Make sure the features you want saved are actually visible in the GDI Display first — use the Zoom commands, the Scroll icon, or Automatically Pan & Zoom to bring them into view.
- Once saved, the BMP file can be used in other applications or placed in a document or presentation.
Plot The GDI Image
Plots the current GDI Image to a printer or plotter, with control over layout, data values shown, and the area plotted.
- With a model open and the GDI Window displayed, select Plot GDI Image from the GDI Utilities branch of the GDI Command Tree.
- A message may remind you to check that the desired items are currently in the GDI Display. Click OK to clear it. The Plot Settings screen is displayed.
- On the Page Layout tab, set the margins, Border Line Width, and Title Font Size; select Include Border and Include Title as needed; select Landscape Orientation to plot along the long edge of the page; and choose a Printer from the list (or click Printer Setup for the Print Setup screen).
- On the Settings tab, select which Plot Data Values to include, set their Font Size (in Printer Points or the default Coordinate Values units), set the plotted size of model data features under Other Settings, choose the Number Of Copies, and select Fit To Page to scale the image to the page (or unselect it to specify your own scale).
- On the Style tab, choose a Plot Style: Plot Current Display, Plot A User Selected Window, Plot Full Extents Of Model & Background Image, Plot A Saved View, or Plot A Saved Plot Window.
- Click Plot to proceed, Close to exit and save the current settings, or Cancel to exit without saving changes.
- If Plot A User Selected Window was chosen, left-click the First Corner and then the Opposite Corner of the plot window in the GDI Display; a dashed box marks the window. Respond Yes to save the selected Plot Window or No to proceed without saving it.
- Review the Plot Preview, then click Continue to send the image to the selected printer, or Cancel to return to the Plot Settings screen.
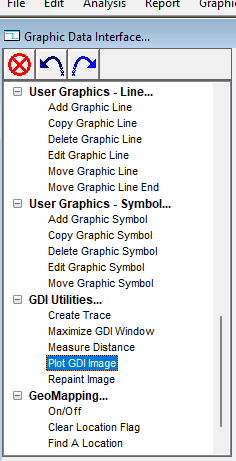
Also runs from the GDI Command List, or by typing PLOT on the GDI Command Line.
Notes
- Not every printer or plotter supports raster-style output; a BMP background image can’t be plotted to a device that doesn’t support raster images.
- GASWorkS’s plotting is meant for good-quality checking, review, and presentation output — it falls short of a full CAD or mapping system’s capabilities. For more sophisticated plots, export the model to DXF and import it into a CAD or mapping application instead.
- If data text clutters the plot, use Move Customer Text, Move Node Text, or Move Pipe Text to relocate it, or adjust Font Size or unselect Plot Data Values on the Settings tab. Data text can appear on a plot even when the GDI Display itself is zoomed past the Display Limit set on the Text Display Settings screen.
Query Specifications Screen
The screen used to build a User-specified selection set for the Make Selection Set routine in the Data Reports, the Color-By-Query routine, and the various Flag Item By Value routines.
The query flags or selects features that match the chosen operator, applied to a data item’s value. Not every operator is available for every data item:
| Operator | Definition | Applies To |
|---|---|---|
| = | Equal To – the Where item’s value is an exact match of the specified To value. | Numeric and string values |
| <> | Not Equal To – the Where item’s value does not match the specified To value. | Numeric and string values |
| < | Less Than – the Where item’s value is less than the specified To value. | Numeric values only |
| > | Greater Than – the Where item’s value is greater than the specified To value. | Numeric values only |
| <= | Less Than Or Equal To – the Where item’s value is less than or equal to the specified To value. | Numeric values only |
| >= | Greater Than Or Equal To – the Where item’s value is greater than or equal to the specified To value. | Numeric values only |
| Ends With | The Where item’s value ends with the specified To string. | String values only |
| Like | The Where item’s value contains the specified To string. | String values only |
| Not Like | The Where item’s value does not contain the specified To string. | String values only |
| Starts With | The Where item’s value starts with the specified To string. | String values only |
| Max | The To number of features with the highest values of the Where item. | Numeric values only |
| Min | The To number of features with the lowest values of the Where item. | Numeric values only |
This screen has no standalone GDI Command List item or Command Line alias — it opens from within the routine that needs it (Make Selection Set, Color-By-Query, or a Flag Item By Value command).
Notes & Considerations
- If Allow Undo Of Data/Graphic Changes is enabled (Utilities > Options & Settings > Environment), click the Undo icon to reverse the last data or graphic change made through one of these routines.
See Also
- Views, Panning, Zooming & Plotting
- Moving Text, Graphics, Legends & Views
- Display & Visibility Settings
- Flagging Customers, Nodes & Pipes
- Example: Color-Coding & Display Limits
FAQ
-
Which model file format should I choose when creating a new model?
For GASWorkS 11 we recommend the “.gwz” format, which stores the entire model as a single file. The older “hdr” format from GASWorkS 10.2 and earlier is still supported, but it stores the model as a group of individual files.
-
Do I have to set the default data values before I start building?We general advise to do so, because every new node and pipe is populated from the current default data values, allowing to avoid setting new values for every imported pipe. Additionally, default data values can be saved, allowing for new models to automatically use the same configuration. As an alternative, you can also select ‘Use Last Record As Default’ on the Default Data tab, which populates a new feature from the last similar feature already in the model.
-
What are the different ways to enter a node’s location?You can type an X-Y coordinate pair (for example, 1000,1000), enter a relative distance and angle prefixed with “@” (for example, @500<180, measured clockwise from north), or draw the segment with the mouse. You can also reference an existing node by name using the "N" prefix — typing "N SUPPLY" uses that node's location.
-
What does a negative load value mean?A negative load indicates gas leaving the system — a demand. Positive values, by contrast, represent gas entering the system.
-
My model has negative pressures after I added the new tap. What happened?Negative (below-zero) pressures mean the system has effectively “run out of gas” — the added demand is greater than the network’s capacity. To address this issue, we generally recommend using the color-coding feature (by Pipe Pressure Drop) to find the pipes with the highest drop, and resizing to a larger pipe where possible.
-
Why do I need to solve the model again after making a change?Any change to the model invalidates the previously computed pressures and flows, so you will need to re-solve to get valid results after you change an input. The Solve icon tells you the state of the calculator at a glance: the scale shows balanced (blue) after a successful solution and unbalanced when a change means a new solution is needed.
-
Can I export the report data to a spreadsheet?Yes. You can save the report directly as a Comma Separated Values (.csv) file and open it in a spreadsheet, or copy the report contents to the Windows Clipboard and paste them into another application. You can also use the Set Columns routine to choose which columns display and print, and build query-based selection sets to filter and sort the records.